
Sample Material of Our Online Coaching Programme
Subject: Data Interpretation
Topic: Line Graphs
Directions: Study the following graphs
carefully and answer the questions given below:
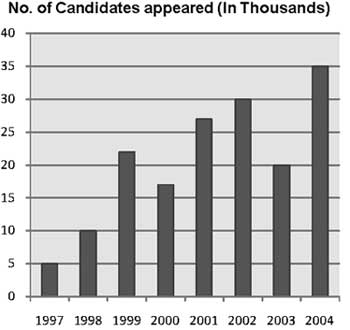
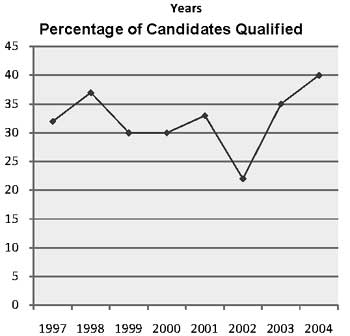
Number of candidates appeared (In thousands) and Percentage of candidates qualified in a Competitive examination over the years
No. of Candidates appeared (In Thousands)
Percentage of Candidates Qualified
1. What was the ratio between the number of candidates appeared in 1997 and the number of candidates qualified in 2004?
(a) 14 : 5
(b) 5 : 14
(c) 3 : 7
(d) Data inadequate
2. In which of the following years was the number of candidates qualified the lowest among the given years?
(a) 1997
(b) 2002
(c) 2001
(d) 1998