
Sample Material of Our Online Coaching Programme
Subject: Data Interpretation
Topic: Bar Chart
Directions: Study the following table to answer the given questions. Number
of Students of Different Classes of a School Playing Different Games
Class.
Directions: These questions ore based on the graph which shows the Demand and Production statistics of the five companies
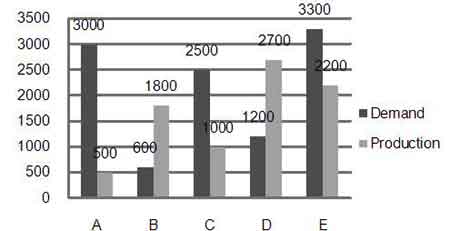
1. What is the ratio of companies having more demand than production to those having more production than demand?
(a) 2 : 3
(b) 4 : 1
(c) 2 : 2
(d) 3 : 2