
Sample Material of Our Online Coaching Programme
Subject: Data Interpretation
Topic: Pie Chart
Directions: Study the following table to answer the given questions. Number
of Students of Different Classes of a School Playing Different Games
Class.
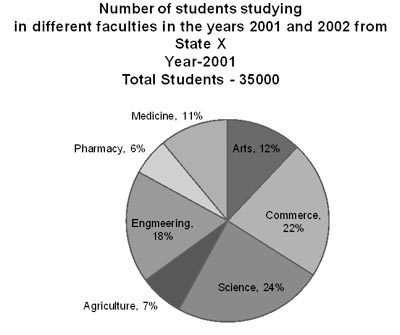
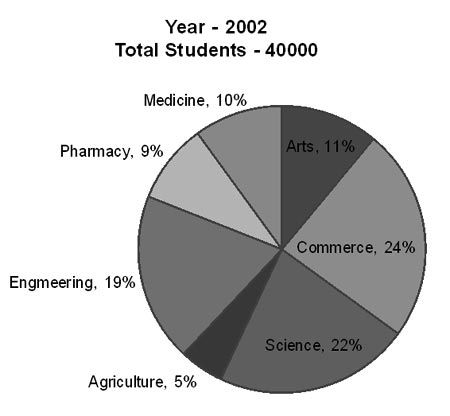
1. In which faculty there was decrease in the number of students from 2001 to 2002?
(a) None
(b) Arts
(c) Agriculture
(d) Pharmacy