
Sample Material of Our Online Coaching Programme
Subject: Data Interpretation
Topic: Table Chart
Directions: Study the following table to answer the given questions. Number
of Students of Different Classes of a School Playing Different Games
Class.
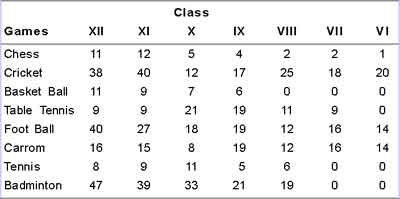
1. Approximately what percent of VIIIth class students play Cricket out of the total students playing Cricket?
(a) 13
(b) 4
(c) 25
(d) 15